Posts

Showing posts from February, 2018

Nifty Analysis

Image
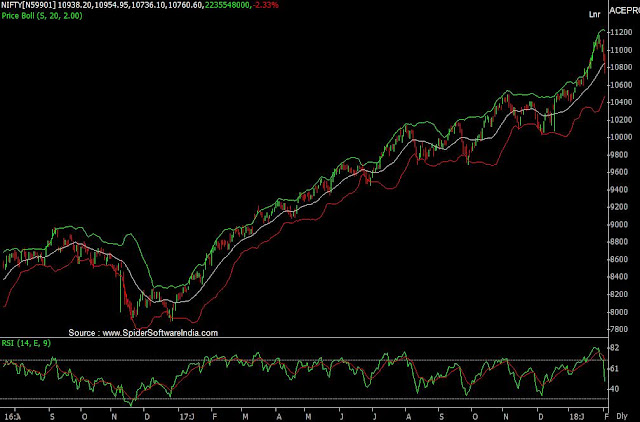
The Nifty 50 Index ends its June expiry this week. Last Friday , the Indian stock markets ended its February futures and options (F&O) expiry. It was the worst expiry for the Indian indices in the last one year. Except for the first day of the expiry where the Nifty 50 Index achieved an all-time high of 11,171, the bulls did not stand a chance. The index started its free fall from day 2 and, subsequently, tumbled down 6.2% from the previous expiry. Nifty Options Analysis : Support : 10000   Resistance : 10700 MAX OI Contracts : 10700 CE - 29.00  Lakhs OI Contracts &  10000 PE - 35.44 Lakhs OI Contracts Sentimental Indicators: INDIA VIX = 14.20 TRIN : 0.35                 (Bullish) NIFTY OI PCR : 1.07  ( Neutral ) Fundamental Indicators: PE RATIO  : 25.75 PB RATIO  : 3.54 DIV YIELD : 1.13 NIFTY INTRADAY FIBONACCI LEVELS CALCULATOR:   https://goo.gl/HyZDEd To know more details of indicators  click on url -  https://goo.gl/hrBirN

Nifty Analysis

Image
Nifty fell sharply in the past two weeks and there seems to be no respite as the indices towards the fag end of this week have erased the entire week’s gains. The PNB fraud case which came to light during the week not only dragged Bank Nifty but also dampened the sentiment across the street. Meanwhile, the country’s exports increased by 9% in January, while trade deficit touched a three-year high of USD16.3 bn due to an increase in crude oil imports.  Nifty Options Analysis : Support : 10600   Resistance : 10500 MAX OI Contracts : 10600 CE - 52.38  Lakhs OI Contracts &  10500 PE - 55.67 Lakhs OI Contracts Sentimental Indicators: INDIA VIX = 16.37 TRIN : 0.73                 (Bullish) NIFTY OI PCR : 0.83   ( Bearish ) Fundamental Indicators: PE RATIO  : 25.32 PB RATIO  : 3.53 DIV YIELD : 1.08 NIFTY INTRADAY FIBONACCI LEVELS CALCULATOR:   https://goo.gl/HyZDEd To know more details of indicators  click on url -  https://goo.gl/hrBirN

Nifty Analysis

Image
The Nifty 50 Index witnessed extreme volatility during the week. On Monday, it opened the session 157 points gap down before recovering a bit to end the session 94 points down. The bears continue to dominate as the index opened 372 point gap down on the next day. It witnesses some short covering during the midweek. But the index again gap down 160 points on Friday and ended the weekly session 3% down. Nifty Options Analysis : Support : 11100   Resistance : 10500 MAX OI Contracts : 11100 CE - 57.64  Lakhs OI Contracts &  10500 PE - 51.47 Lakhs OI Contracts Sentimental Indicators: INDIA VIX = 19.23 TRIN : 0.43                 (Bullish) NIFTY OI PCR : 0.87   ( Bearish ) Fundamental Indicators: PE RATIO  : 25.27 PB RATIO  : 3.57 DIV YIELD : 1.08 NIFTY INTRADAY FIBONACCI LEVELS CALCULATOR:   https://goo.gl/HyZDEd To know more details of indicators  click on url -  https://goo.gl/hrBirN

Trend lines

Image
Trend lines Trend lines are lines drawn at an angle above or below the price. They are used to give indications as to the immediate trend and indicate when a trend has changed. They can also be used as support and resistance and provide opportunities to open and close positions Drawing trend lines The chart below shows an example of a trend line in a downtrend and an uptrend. Shows three swing highs on the downtrend Shows three swing lows on the uptrend When drawing trend lines in a  downtrend , you draw them  above the price. When you draw trend lines in an  uptrend , you draw them  below the price.  It is the highs on a downtrend and the lows on an uptrend that will determine a trend line. At least two  swing highs or swing lows are needed to draw a trend line in either direction. However, for a trend line to be valid, at least three highs or lows should be used. Essentially, the more times the price touches a trend line, the more valid it is, because there ar

What Is a Trading System

What  Is  a Trading System?        By Van K. Tharp, Ph.D. Traders are constantly asking us “What exactly is a system?”  The purpose of this article will be to give you that information as clearly as possible.  First, we’ll go through some background information to help you understand what a system is outside of the context of trading. You’ll learn how different people relate to systems according to how they relate to money.  The second part of this article will focus on clearly defining what a trading system is. The third part of this article will focus on the broader picture of your system—your trading plan.  Finally, we’ll focus on some key elements in system development. Business Systems In Robert Kiyosaki’s book,  Cash-Flow Quadrant , he distinguishes two types of people who work for money and two types of people who have money working for them.  In each case, one of the major distinguishing characteristics is how they deal with systems.  First, let’s look at the idea of

Smart Trading Calls : 8th Feb

KAJARIACER : CMP 603.15 Buy Price : 610 Stop Loss : 597  Target : 615 / 621 Click URL to view updated details -  https://goo.gl/NdEeUg DISCLAIMER :   view

Smart Trading Calls : 7th Feb

SREINFRA SPOT : CMP 76.25 Buy Price : 77.5 Stop Loss : 75.2 Target : 79.4 / 83.14 / 89.4 SREINFRA FERB FUT: CMP 76.6 Buy Price : 77.9 Stop Loss : 75.8 Target : 80.1 / 83.9 / 89.8 Click URL to view updated details -  https://goo.gl/NdEeUg DISCLAIMER :   view

Nifty Analysis

Image
The Nifty 50 Index witnessed extreme selling pressure this week. It started the week on a positive note with the index rallying 60 points to touch a new life-time high. But the buying was temporary, and it slipped 80 points on the very next day. The pressure continued until Thursday where the index witnessed wild swings as the Finance Minister presented the FY19 Union budget. Finally, on Friday, the bears continue to dominate, as the index fell 256 points in a single day to end the weekly session nearly 2.80% lower. Nifty Options Analysis : Support : 11500   Resistance : 10500 MAX OI Contracts : 11500 CE - 65.29  Lakhs OI Contracts &  10500 PE - 59.84 Lakhs OI Contracts Sentimental Indicators: INDIA VIX = 15.25 TRIN : 1.41                  (Bearish) NIFTY OI PCR : 0.82  ( Bearish ) Fundamental Indicators: PE RATIO  : 26.04 PB RATIO  : 3.64 DIV YIELD : 1.05 NIFTY INTRADAY FIBONACCI LEVELS CALCULATOR:   https://goo.gl/HyZDEd To know more details of indi