Nifty Analysis
The Nifty 50 Index traded on a negative note during the week.
On Monday, it opened the session gap down and plunged 100 points. The negative momentum continued until mid-week where the index slipped to a low of 10,141. It bounced back nearly 90 points towards the end of the week. On Friday, the index resumed its down move and ended its weekly session 2.21% down.
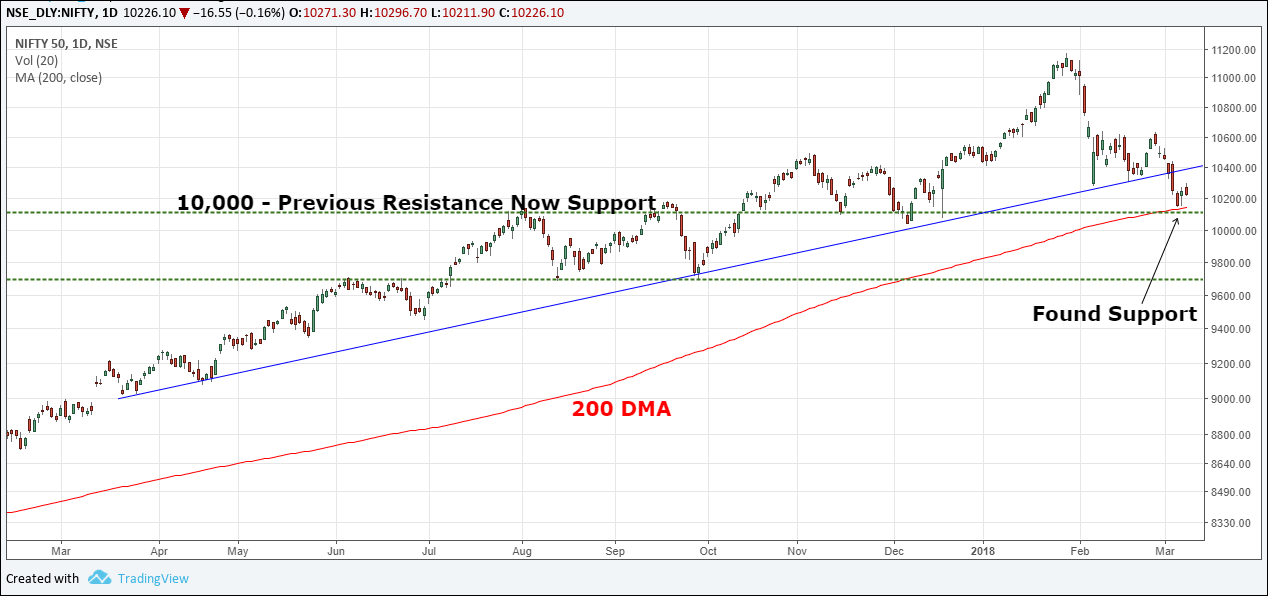
Last week, we observed the index finding support from the rising trendline (blue line). But this week, it broke below this trendline and plunged to touch a low of 10,141.
The index has now found a strong support near this level from the horizontal line (previous resistance now support). The 200 day moving average (DMA) also acted as a good support for the stock

Nifty Options Analysis :
Support : 10000 Resistance : 10500
MAX OI Contracts :10500 CE - 54.88 Lakhs OI Contracts & 10000 PE - 49.16 Lakhs OI Contracts
Sentimental Indicators:
INDIA VIX = 14.52
TRIN : 1.48 (Bearish)
NIFTY OI PCR : 0.85 (Bearish)
TRIN : 1.48 (Bearish)
NIFTY OI PCR : 0.85 (Bearish)
Fundamental Indicators:
PE RATIO : 24.97
PB RATIO : 3.45
DIV YIELD : 1.28
PB RATIO : 3.45
DIV YIELD : 1.28

Comments