Central Pivot Range (CPR)
CPR is another popular tool. Three lines are plotted on the chart when we plot CPR. The three lines are: CPR, TC and BC. Let’s understand the calculation.

You may recall that I explained the calculation of Pivot levels in an earlier thread. CPR stands for Central Pivot Range. It is always a center line of the three lines that gets plotted in the chart.
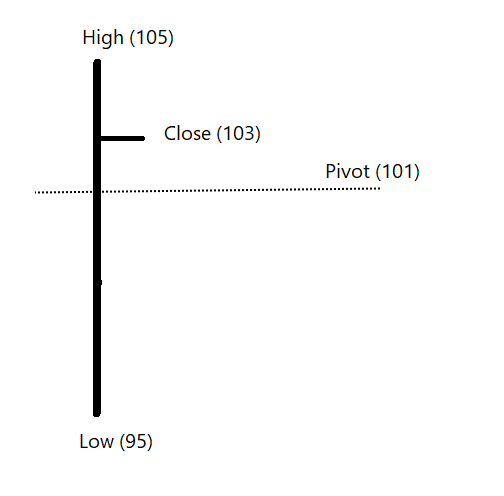
CPR is a Pivot price. Pivot is average of HLC as explained in the prev thread.
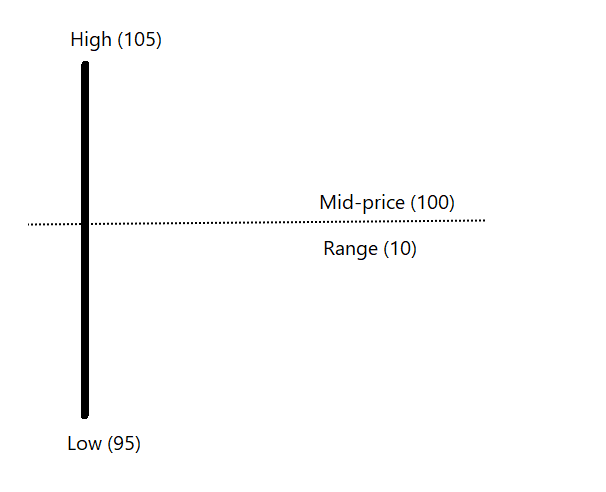
We also discussed about Mid-range of the session. Mid-range is average of High and low price of the session.
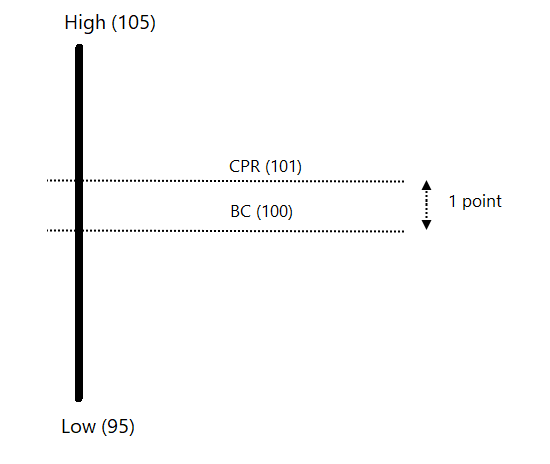
The mid-range of the bar is known as BC in the CPR calculation. BC stands for Bottom central pivot.
Pivot level captures the relationship of the closing price to the range of the session.
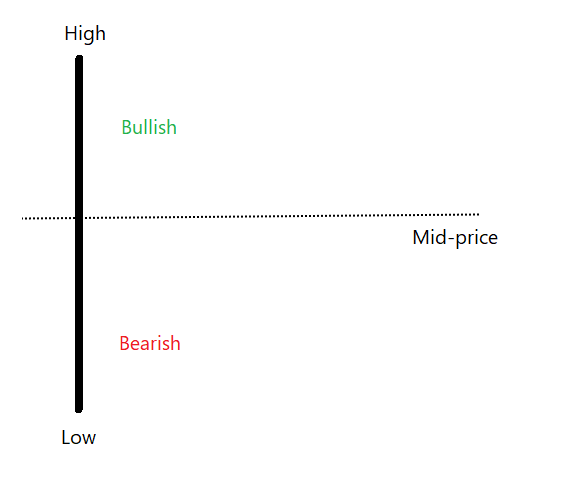
Pivot price above mid-price = bullish pivot
Pivot price below mid-price = bearish pivot
So, CPR line is Pivot and BC line is Mid-range.
What is the difference between both?
Mid-range is average of High and Low.
Pivot is average of High, Low and Close.
What will make the difference between the two?
Close.
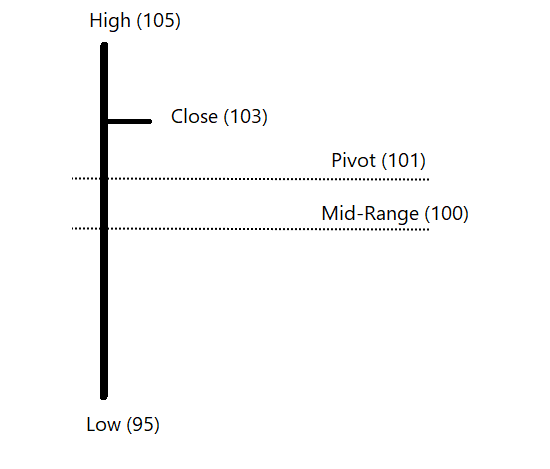
Difference between CPR and BC shows how is closing price placed compared to the mid-range of the session.
If close is near to the mid-range, the distance will be low. If close is far, the distance will be wide. We’ll come back to this discussion in a while.
Let’s discuss TC.
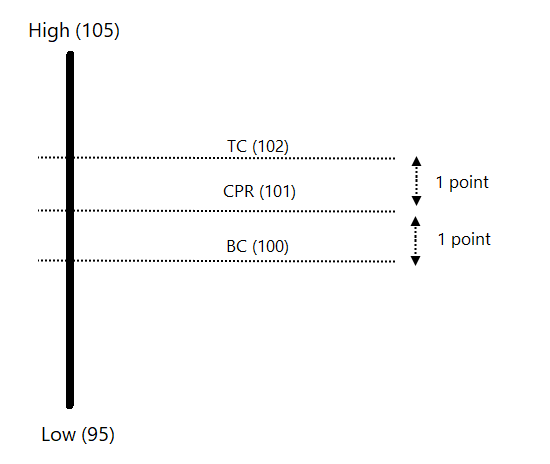
TC stands for Top central Pivot.
You will easily find the formula if you google it:
TC = (CPR – BC) + CPR
Why this formula? What does that mean?
Itna sab kyun sochna hai. Dimag ko itna taklif nahi dene ka, software sab plot karta hai, use karne ka😊
The idea of TC is to create the equidistance bands.
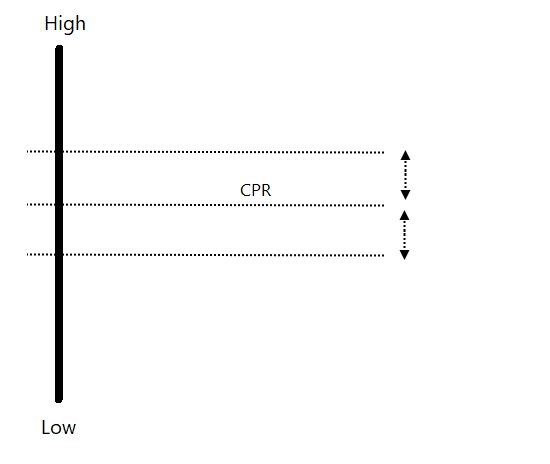
If the difference between CPR and BC is 1 point, TC will be placed at -1 point from CPR. If the distance between CPR and BC is -1, TC will be placed at +1 point from CPR.
Clear? Let's discuss more.
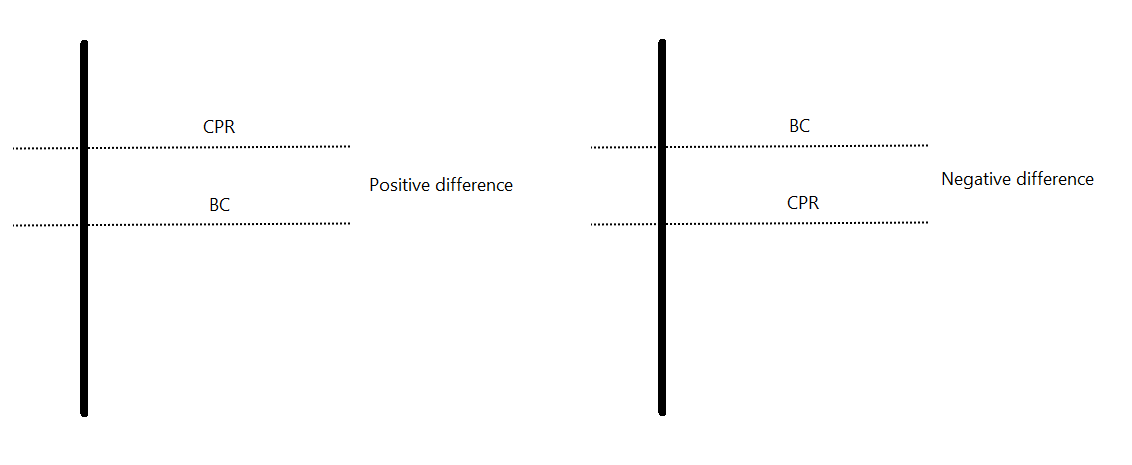
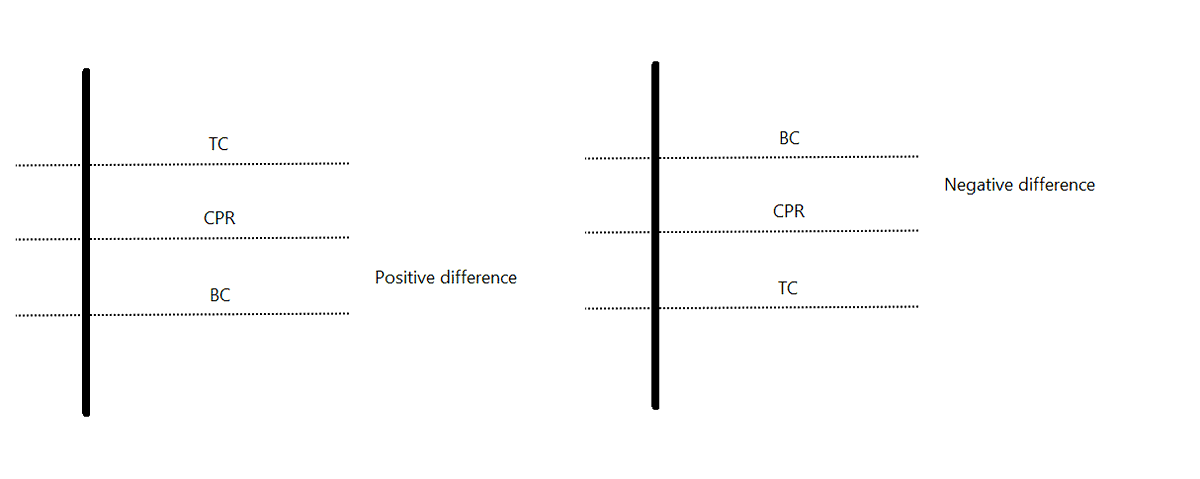
Since calculation is CPR minus BC and add back to CPR, the distance between CPR and BC will be a positive number if CPR line is placed above BC (Bullish Pivot). If CPR is below BC then difference will be a negative number (Bearish Pivot).
Meaning, the difference between CPR & BC, and CPR & TC will be equal. CPR will always be at center.
If the difference is positive, TC will be placed above CPR and at same distance. If difference is negative, TC will be placed below CPR at same distance.
In simple words, CPR are equidistance bands created based on difference between pivot and mid-range of the previous trading session.
You may or may not trade this, but understanding various concepts will definitely help you in the long-run.
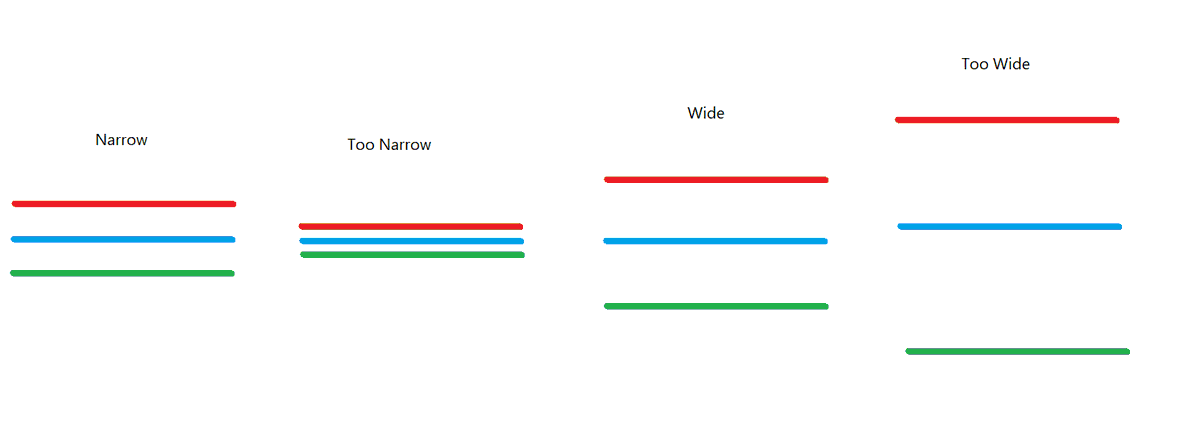
When the distance between the bands is narrow, it’s a narrow CPR. When distance between bands is wide, it’s a wide CPR.
Have a look at the images below to get an idea about Narrow, too narrow, Wide and too wide CPR bands.
Ask yourself when will the bands will be narrow?
The answer is when the distance between Pivot and Mid-range is small.
And when will they be wide?
When the close is away from the mid-range?
When will that happen?
During strong trend... right?
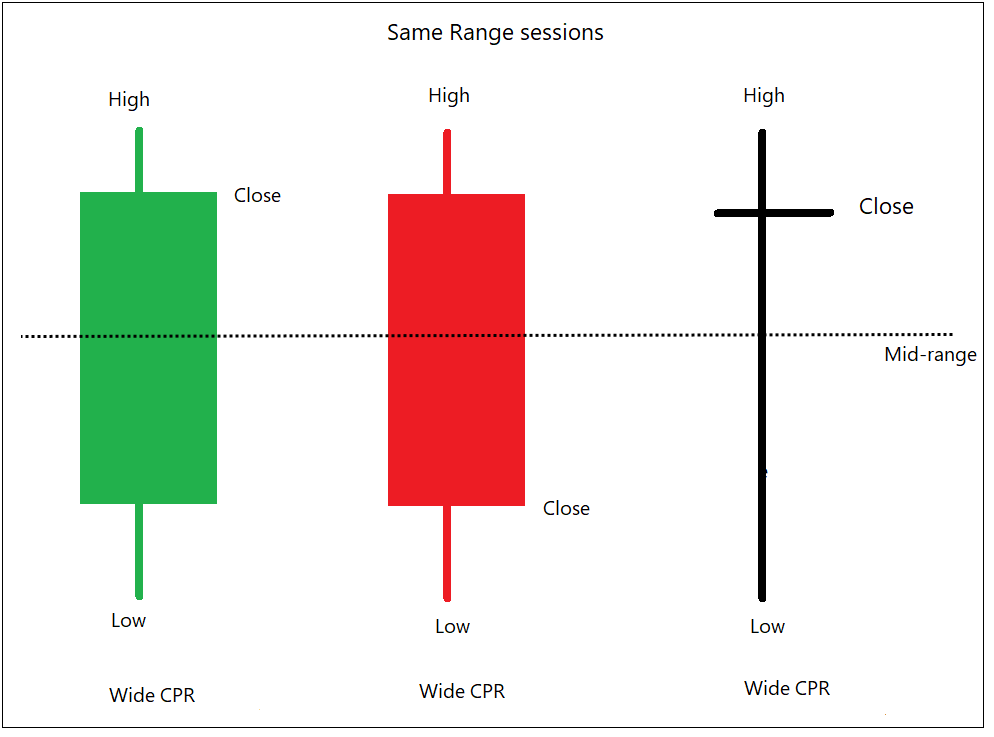
Narrow bands would mean that the close was near the mid-range. Even if trend was strong during the day, it turned weak towards the close.
Wide bands would mean trend was strong towards the close. Large length bar can occur during strong trends, or high volatility.
If you wish to explore these concepts further, you can read the following books:
•The logical trader by Mark Fisher
•Secrets of a Pivot boss by Franklin Ochoa.
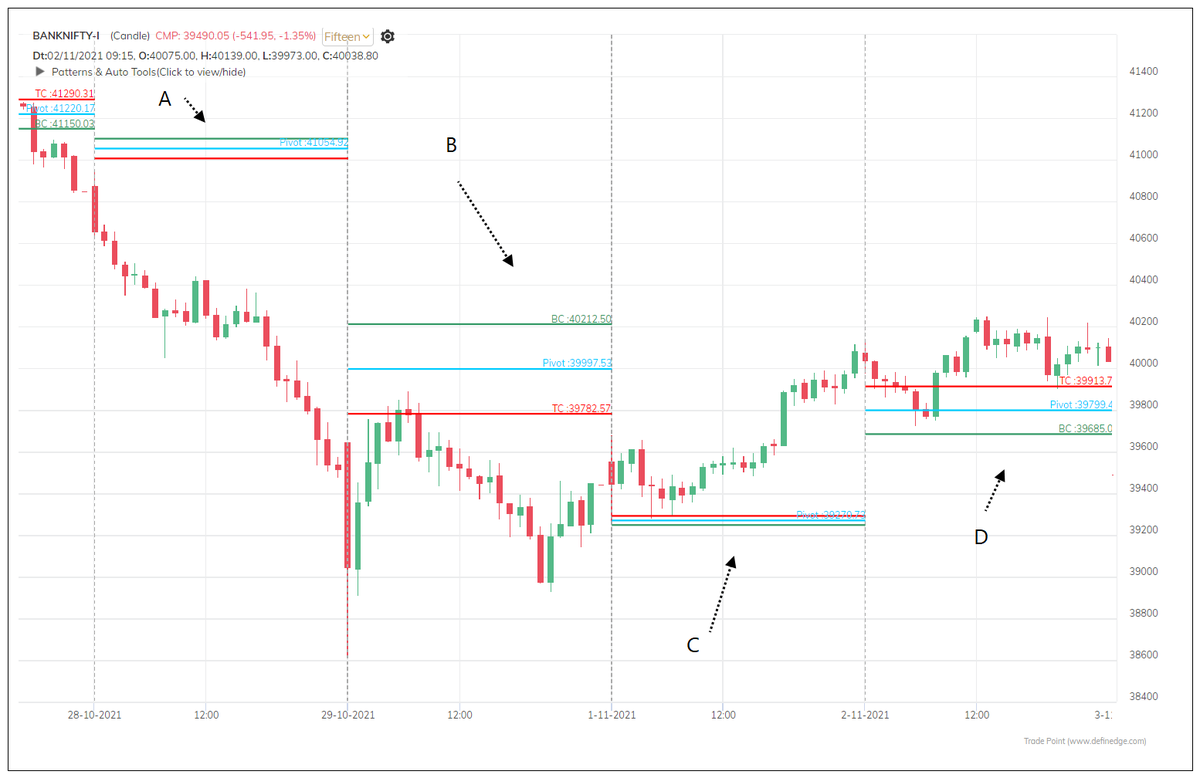
Have a look at the recent Bank Nifty chart shown below.
A is Narrow band
B is Too Wide
C is Too narrow
D is Wide
Study the earlier day trend to understand the shape of bands.
When the price is away and bullish from the CPR bands – it’s a strong up trend.
When the price is away and bearish from the CPR bands – it’s a strong down trend.
Stronger the trend, wider the CPR.
CPR band area could be regarded as important support & resistance area during sideways market, and important pullback area during strong trending markets.
Price will remain within CPR bands, if a strong trend candle is followed by a narrow or medium range market.
If strong candle is followed by another strong candle, price will drift away from CPR bands.
Current day Band above previous day pivot band is considered as bullish and bands below previous day are considered as bearish.
Price opens above band and trading at significant distance from pivot is a strong trending market. It’s a strong trend day when price do not even touch CPR bands. This is also called as Virgin CPR.
Two imp uses of CPR: Pullback area during strong trends & virgin CPR sessions.
These studies are mainly for short-term traders. You can combine it with other tools, patterns, and indicators. You can add Pivot tables and camarilla along with this study.
You can plot them on noiseless chart as well. CPR is calculated based on previous day bar range.


Comments