Stochastic Indicator

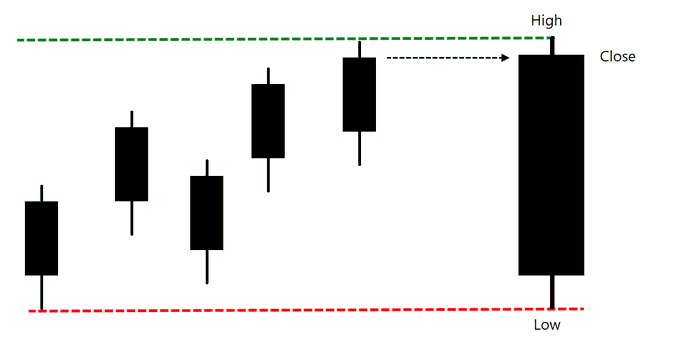
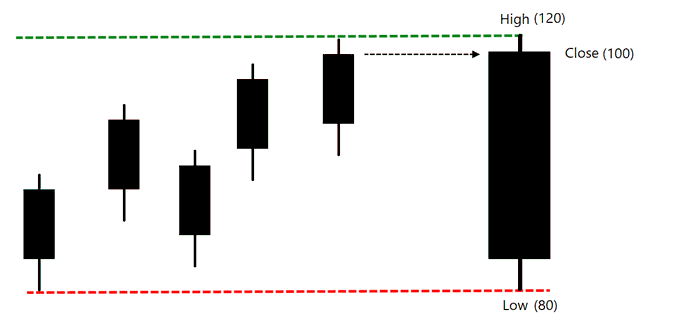
What if we calculate Close - Low of this merged candle, what will it show? It would capture how far the closing price is from the lowest price of last five sessions – right? Let us call it CL. In above example, closing price is 100 and Low is 80 so CL is 20.
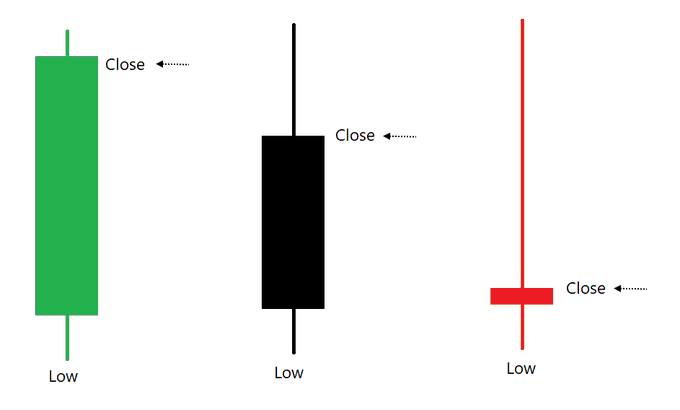
If the value of CL is a big number, it is a bullish sign, indicating price is closing way higher from the low. Similarly, if CL is a small number, it is bearish. See the image.
But how do we know whether it is high or low just from the absolute number? We can get to know that if we divide this by range – Let’s call it K. So in the earlier Example, CL is 20 and range is 40: K is 50%. (20 / 40 x 100). K shows us how strong or weak the CL is.
If CL is 30 and range is 40, K is 75%. This is bullish because current price is near the high of the last 5 sessions. It is going up. If CL is 10 and range is 40, K is 25%. This is bearish because current price is near the low of last 5 sessions.
This way, we can calculate CL and Range every day. George Lane developed Stochastic indicator during late 1950s. If Stochastic parameter are 5, 3, 3: CL and Range is calculated over last 5 bars. Average of CL and Range is calculated over last 3 bars.
%K = (Average of CL) / (Average of Range) %D = 3-bar average of %K. Simple average method is used in all calculations. Stochastic indicator oscillates between 0 and 100.
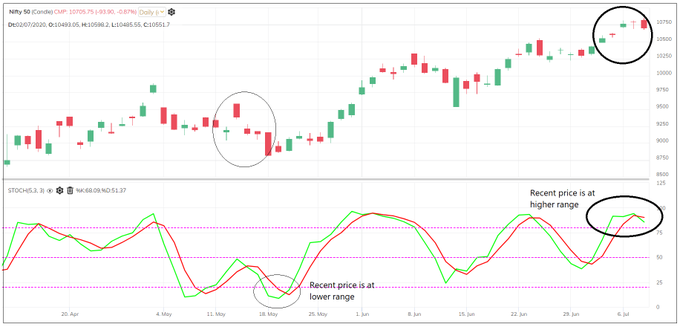
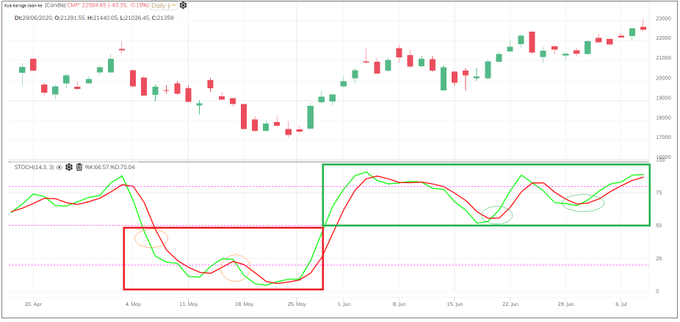
See this image. It is 5,3,3 Stochastics. When Stochastic indicator is at upper range – it shows that recent price is at the upper range of last 5 candles. If stochastic indicator is at lower range – it shows that recent price is at lower range of last 5 candles.
Stochastics shows momentum of price. Bullish momentum = price is near its high in a given time period Bearish momentum = price is near its low in a given time period
Stochastics above 50% shows that current price is above the mid-range price. So, Rising Stochastics and above 50% indicate bullish momentum and falling Stochastics below 50% indicate bearish momentum. 5,3,3 and 14,3,3 are popular parameters.
There are many ways to trade Stochastics. But I think to keep it simple: Stochastics above 50% and %K above % D = Bullish Stochastics below 50% and %K below %D = Bearish.
Remember, unlike RSI and many other indicators – Stochastics considers High and Low in the calculation. It is important to note this distinction. We should learn what is the characteristics of the indicator. It will help us in the long run.


Comments