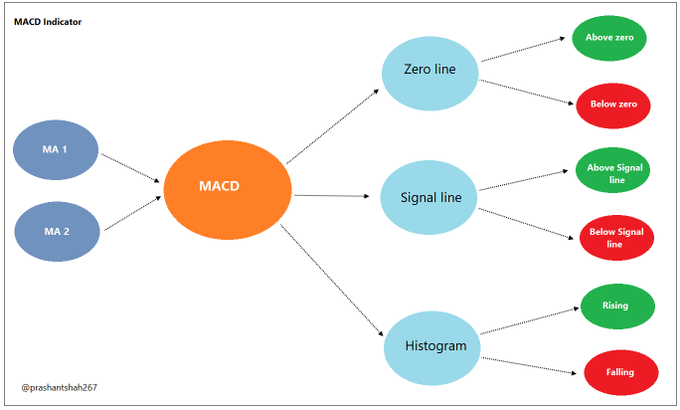
MACD –> Histogram –> Disparity
MACD is a popular indicator created by Gerald Appel. MACD stands for Moving Average Convergence Divergence.
When we plot two moving averages in a chart, the trend is considered bullish when the short-term moving average (Lower parameter) is above the long-term moving average (higher parameter) and bearish when the short-term average is below long-term average.
Can you decipher why this is the case? Ask yourself what will cause the short-term average to be above the long-term average? The short-term average will be above the long-term average when there are more bullish prices in short-term.. right?
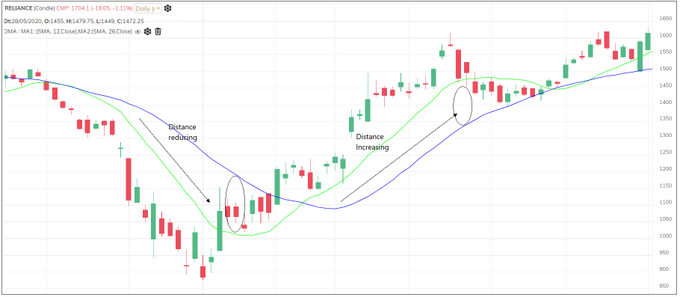
So, if the short-term trend is strong, the distance between both averages will increase. So, the distance between averages can be an important indicator to gauge the strength of the short-term trend. MACD line calculates the difference between two averages.
Short term average – Long term average = MACD So, When the Short-term MA > Long-term MA, the MACD line will be above zero When the Short-term MA < Long-term MA, the MACD line will be below zero In simple words, MACD line above zero is bullish & MACD line below zero is bearish
MACD line hovers around zero line during sideways mkt or when trend is not established. Moving averages keep criss-crossing around each other during sideways mkts. Rising MACD lines means the distance between ave is increasing & falling MACD line means the distance is reducing.
So, MACD line > 0 + Rising = Trend is bullish and distance between averages is increasing MACD line < 0 + Falling = Trend is bearish and distance between averages is increasing
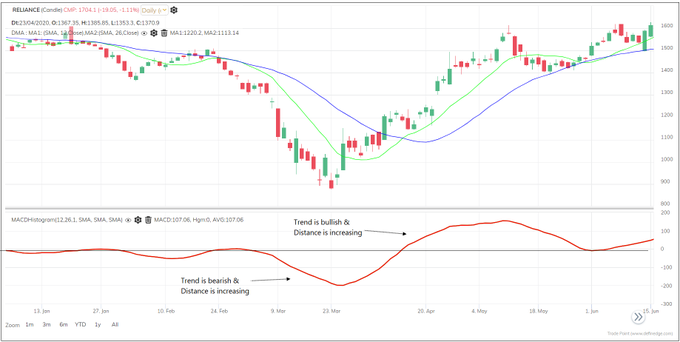
This also means, MACD line > 0 + Falling = Trend is bullish but distance between averages is reducing MACD line < 0 + Rising = Trend is bearish but distance between them is reducing
When the distance between two averages is widening, it shows that the trend is strong. But it can also mean exhaustion. There is a possibility that price will correct or revert to ave line. So, the MACD line turning down could indicate an exhaustion in the short-term trend.
The average of MACD line is plotted on the chart for smoothing it and capturing this indication. It is known as the signal line. Now we have two lines: MACD line and Signal line.

MACD line turning below Signal line indicates that even though the short-term average is above long-term average, difference is reducing and vice versa. It was realised that one can read and interpret the difference between MACD line and signal line as well.
The difference between MACD line and Signal line is typically plotted as a MACD Histogram on the chart. It was developed by Thomas Aspray.
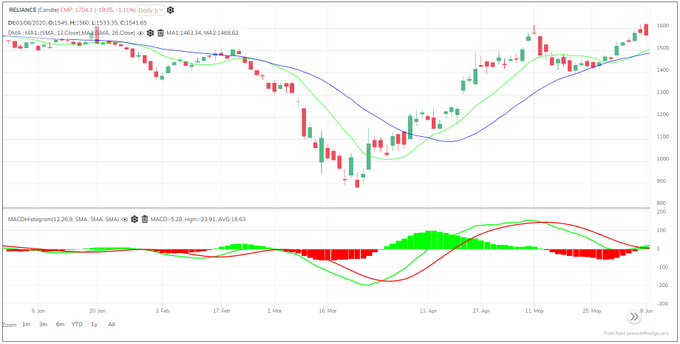
So, Bullish MACD Histogram bar = MACD line > Signal line Bearish MACD Histogram bar = MACD line < Signal line Rising histogram = Difference between MACD line and signal line is rising Falling histogram = Difference between MACD line and signal line is falling
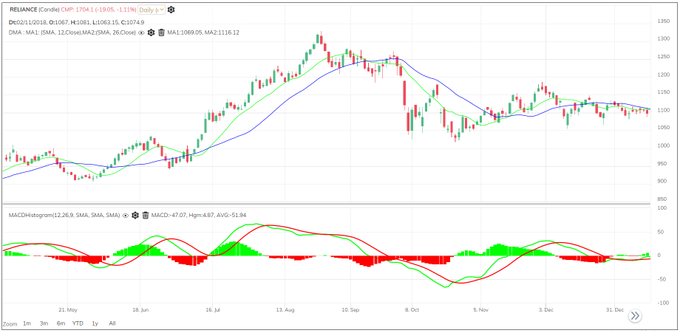
Clear what is MACD and Histogram? See the image. When everything is in green box, trend is bullish and strong. When everything is in red box, trend is bearish and strong.
When MACD line is above zero but Signal line is bearish or Histogram is falling, it shows convergence. But remember, at times, averages converge even during strong trends and then resume the trend.
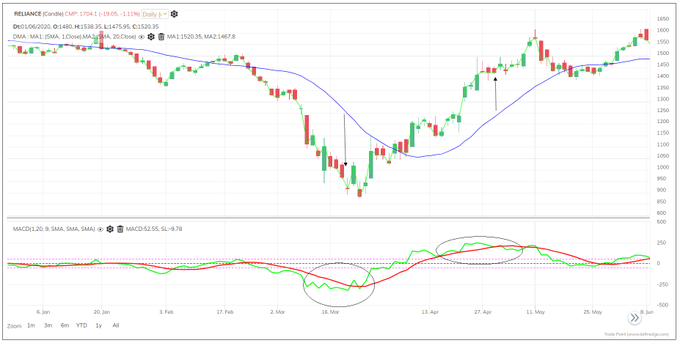
MACD indicator is useful to read MA crossovers, and strength of the short-term trend. Short-term or Long-term depends on the style of trading. The typical and popular settings for MACD indicator is 12-period for ST MA, 26-period for long term MA and 9-period for the Signal line
What if short-term moving average parameter in MACD is 1? It will be a proxy for the actual price.. right? This way, it will calculate the distance between price and average line. In this case, Rising MACD line would mean distance between price and Moving average is rising.
This concept of price and average line distance is also known as Disparity. Disparity index indicator was introduced by Steve Nison in his book, Beyond Candlesticks. Disparity index calculates distance between price and Moving average


Comments