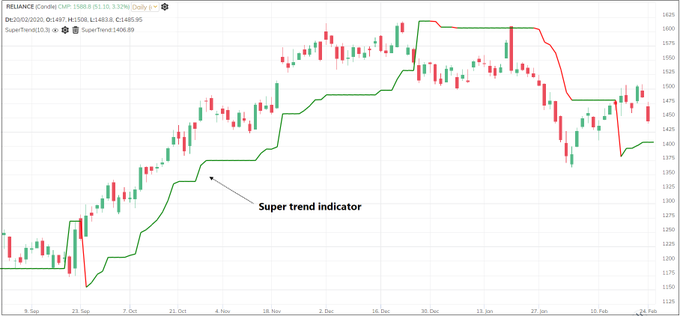
Super trend indicator:
Developed by Olivier Seban, Super trend is an indicator plotted on the price chart like a moving average.
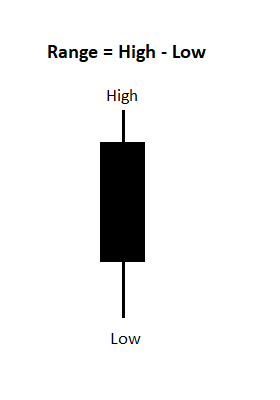
Let us discuss three important components of this indicator. 1: Range-price. In every bar or candle, we have four prices - Open, High, Low, Close. We have the option to select any price of above to define the trend
For example, we may define an uptrend as today’s close being above yesterday’s close. We can also calculate range price of every bar. It is also known as Average price or Mid-price. Range price = (High + ow) / 2
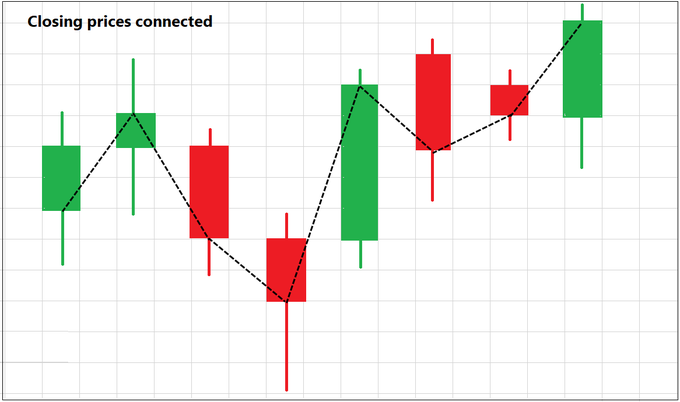
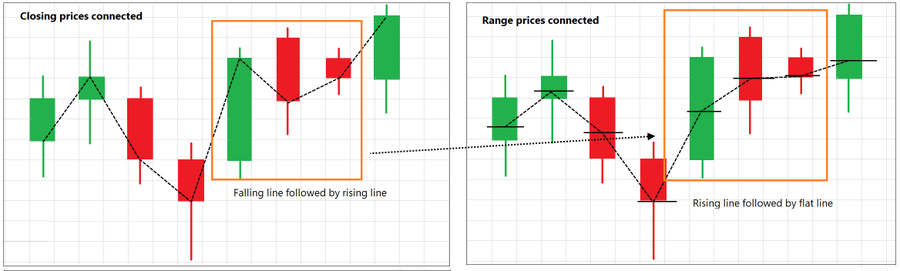
Have a look at the images below. In the first Image below , the closing price of each candle is connected to the closing price of the next candle
In the below chart, the “range-price” or the mid-point of each candle is connected.
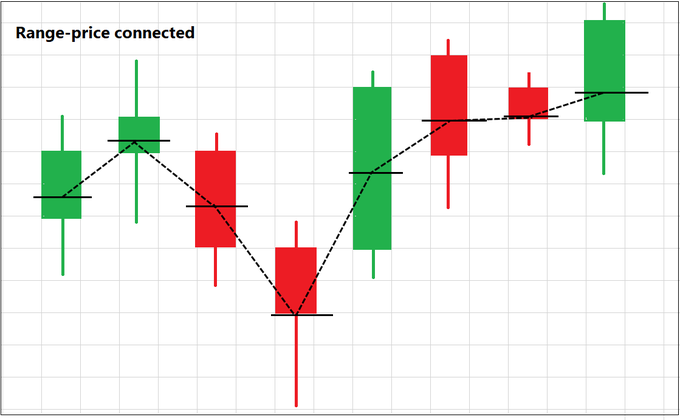
Do you notice any difference between the two charts? It is obvious that the curve with mid-price is relatively smooth. It should be apparent that the range should expand for the Range-price average line to move. Understood how to calculate range price of every bar?
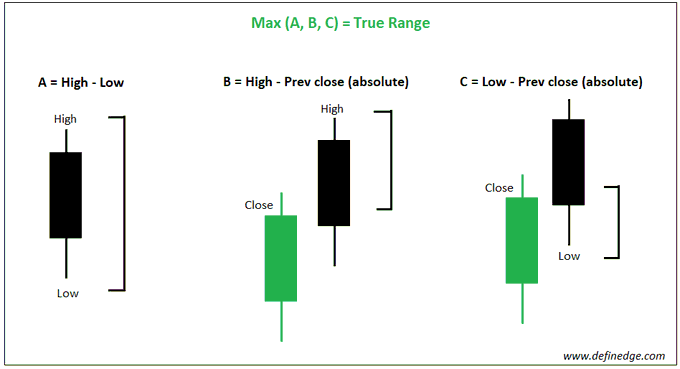
Now that the first component is discussed, we will shift focus to the second component - ATR We have discussed ATR in past threads (ADX and ATR%). ATR (Average True Range) is an indicator developed by J.Welles Wilder.
His work is used by many others in developing different studies. Our fraternity always remains thankful to him for his amazing contribution. Remember ATR calculates true range of every bar. It measures the volatility of an instrument over last several period.
E.g. if 10-day ATR of Reliance is 40 points, the average range of Reliance price over last 10 candles is 40 points, right? Trend even if bullish, volatility can interrupt and make it difficult for us to follow it. To be able to read trend clearly, we need to discount the vol.
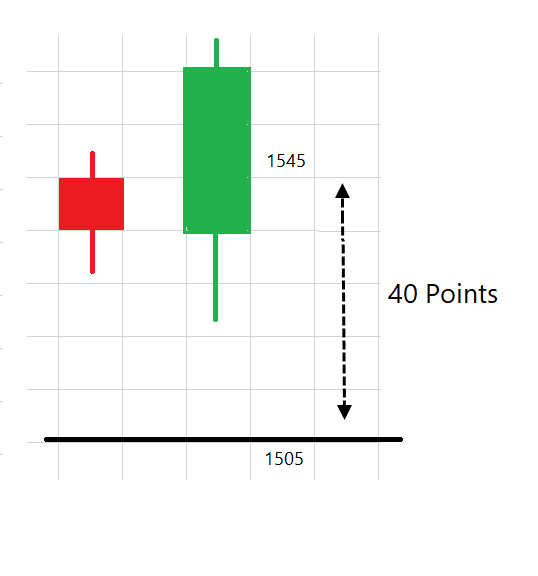
Let us plot a line equal to ATR value over last 10-period. Let’s call it a Trend indicator. The Trend indicator = Price minus ATR. The price in the above formula is the Median price or Range price. So, we will calculate Trend indicator using the Range price.
If ATR is 40, and the median price is 1545 then Trend indicator value would be 1545-40 = 1505.
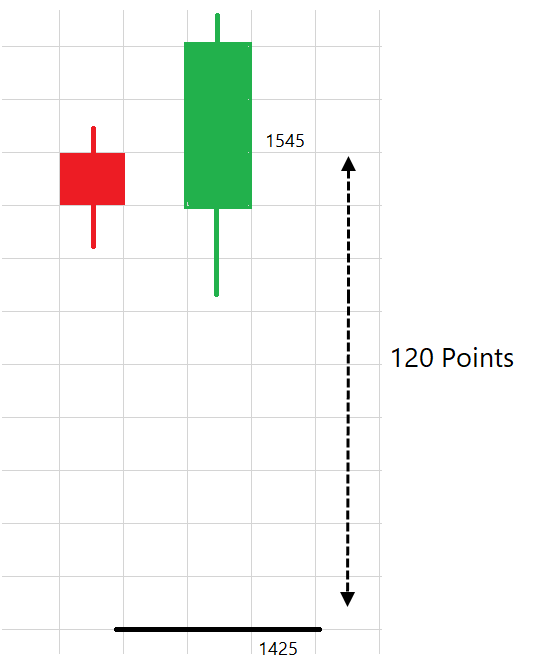
3. Let us now study the third Component - Multiplier 1- ATR is not sufficient as volatility can expand and the indicator line can turn volatile. To handle this, we can multiply ATR value by a constant. Let us multiply it by 3 and place a line at 3x of ATR value.
So, if 1-ATR is 40 points, 3-ATR is 3 x 40 = 120 points. So, the Trend indicator value will be Range-price minus (3 x ATR value) or 1545 – 120 = 1425.
You have to define two variables in the calculation - the Trend & Multiplier. Recommended values are 10 and 3. We take a look at the ATR of last 10 bars and multiply it by 3.
Bullish Trend indicator Value = Range price - (3 x ATR) Example: 1545 - (3 x 40) = 1425 Bearish Trend indicator Value = Range price + (3 x ATR) Example: 1545 + (3 x 40) = 1665 Clear so far?
Price is bullish as long as it is trading above bullish value and bearish as long as it is trading below bearish value. So, this line can act as a trend filter. It can also be used a trailing stop-loss mechanism. But there is a catch here!!
What if the trend is up & the volatility increases too? In such a scenario, the stop-loss can get lower. How do we deal with that?
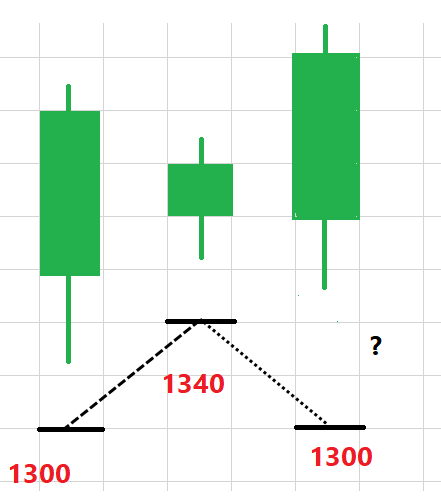
If we allow this to happen, the trend indicator line will be very volatile and have little value from practical trading perspective as the stop loss can theoretically move below previous level.
The Solution to this problem is to make this line go flat when volatility rises. See below image.
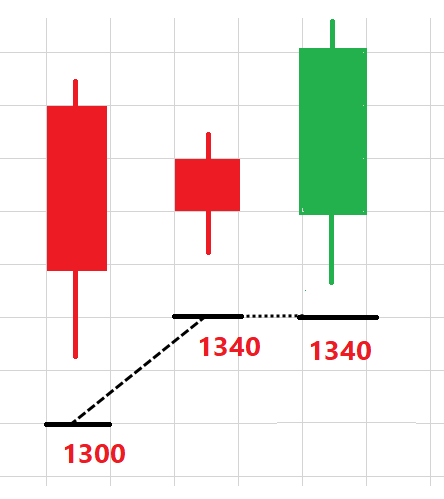
This adjusted line or indicator is known as the Super trend indicator. If price is trading above the Super Trend line and if the current close remains above that it is bullish. If the range price is bullish, super trend line will be rising.
If recent volatility is high, super trend line will be flat. Vice versa if price is trading below Super trend line
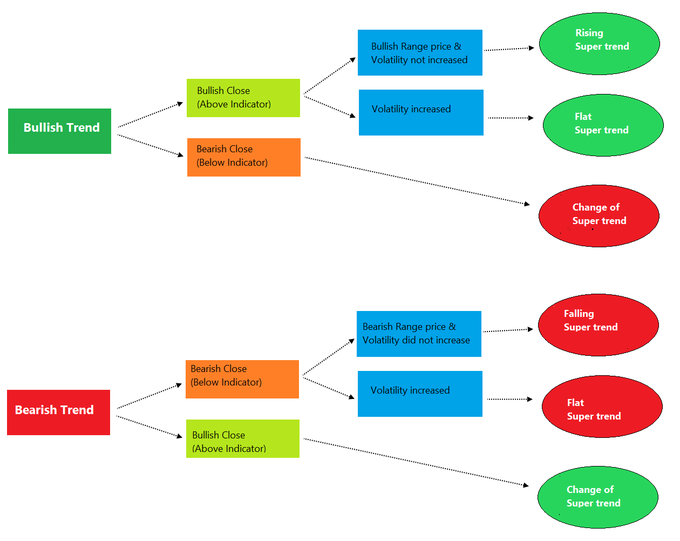
Super Trend is a volatility-based trend indicator. Remember, super trend line increases when range price is bullish, & volatility does not expand. Similarly, super trend line falls when the range is bearish and the volatility has not expanded. In other instances, it remains flat.
A rising Super Trend line is bullish and a falling line is bearish. Flat line indicates either unfavourable close (sideways) or a volatile phase. Trend is bullish as long as price is trading above super trend indicator, and bearish as long as it is trading below the indicator.
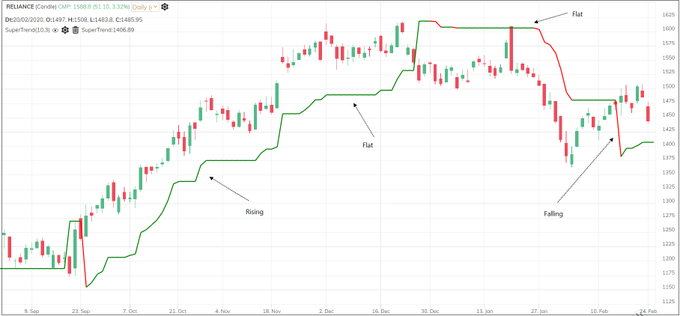
The indicator can be useful for identifying trend, or trailing stop-loss etc. It considers volatility and goes flat are its important features. Understood the logic? 10 and 3 are the default values. What if I chose multiplier 2 instead of 3? How will that change its behaviour?
Spend time on understanding behaviour of indicator. You may get ideas from that. Trading comes later. Purpose of my posts is to promote logical understanding of indicators, think beyond buy-sell nature of indicators. End of thread.


Comments