Pivot levels
Trading based on Pivot levels is one of the popular approaches. Both short-term and intraday traders track Pivot levels to identify support and resistance levels in any instrument. Let’s discuss how these levels are calculated.
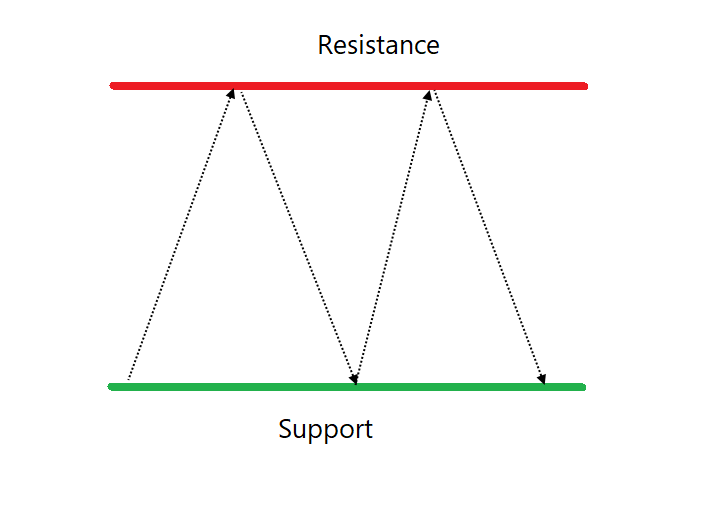
The pivot calculation method considers the previous day prices to calculate the support and resistance levels.
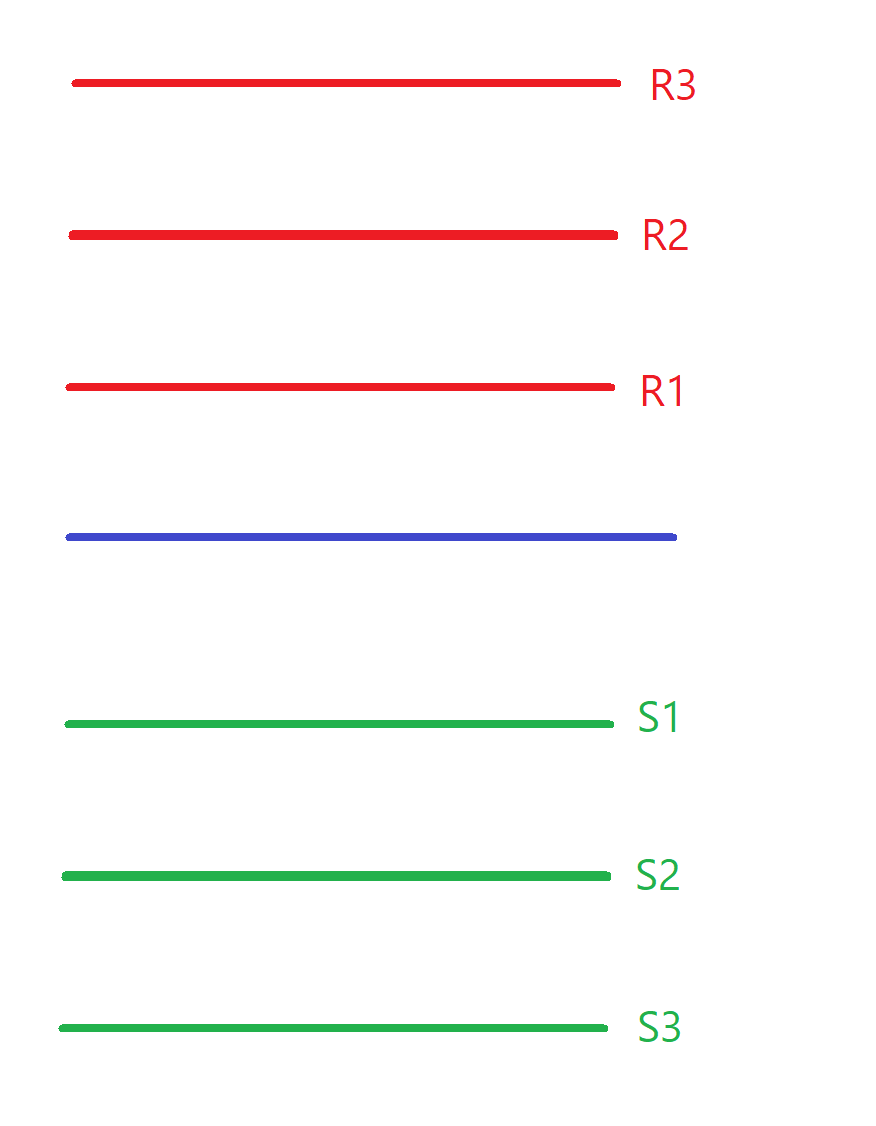
There are seven levels marked on the chart when we plot Pivot as a tool.
There is a Pivot level, 3 support levels (S1, S2 & S3) & 3 resistance levels (R1, R2 & R3).
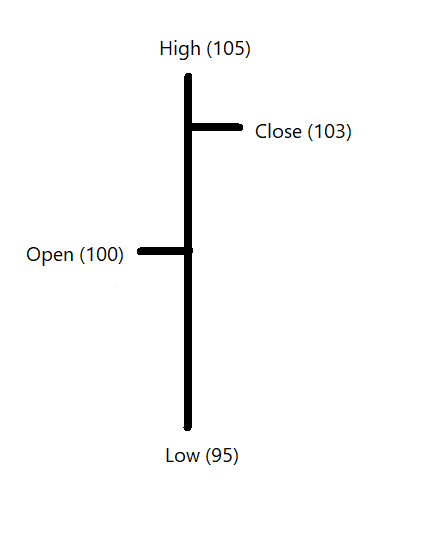
We have four prices for any trading session - Open, High, Low, Close.
They give us the important information about what happened during that session. Levels is calculated using the High, Low & Closing price of the previous day. Let’s understand Pivot calculation with an example
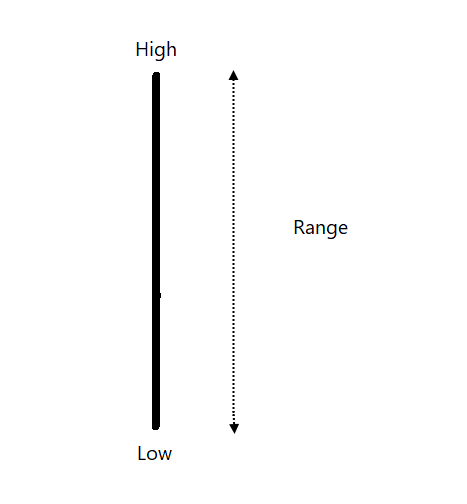
The difference between high and low is a range of the day.
High – Low = Range
In our example, range of the session is 10 points.
105 – 95 = 10
Mid-price of the session is average of high and low price.
The Mid-price in this case would be 100.
(105 + 95) / 2.
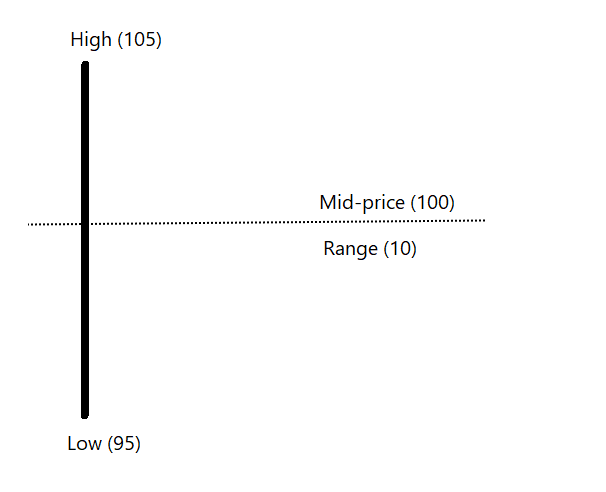
Mid-price is average of range of the session. How about including the closing price to this calculation?
If we calculate the average of High, Low and Closing price - we get the Pivot point.
(105 + 95 + 103) = 101 is the Pivot level in our example.
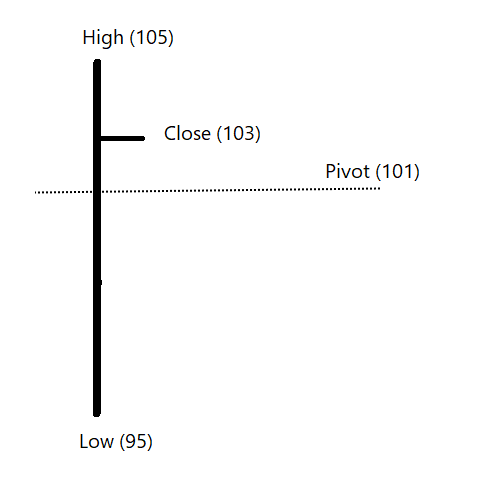
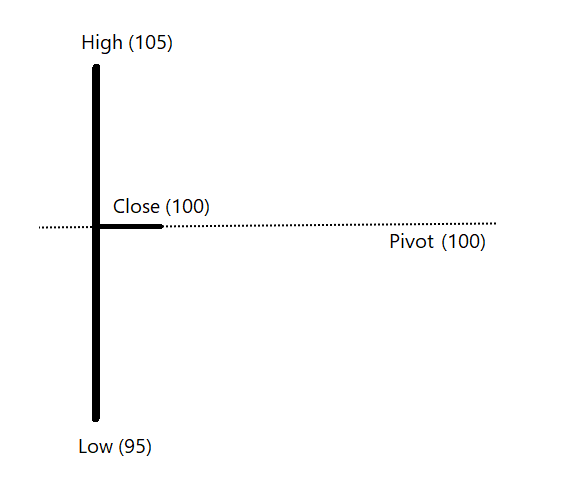
Take a pause and spend some time to think about this method. What would be a Pivot point had the close would be exactly at the mid-price of the session?
Mid-price is 100. Had closing price also be at 100, pivot price would have been equal to mid-price of the session.
The Pivot point in this example was 101 when closing price was 103 i.e., closer to the high.
What if the closing price was at 97? The Pivot level in this instance would be 99. (105 + 95 + 99) / 3.
The pivot price is an important reference level for the next day session.
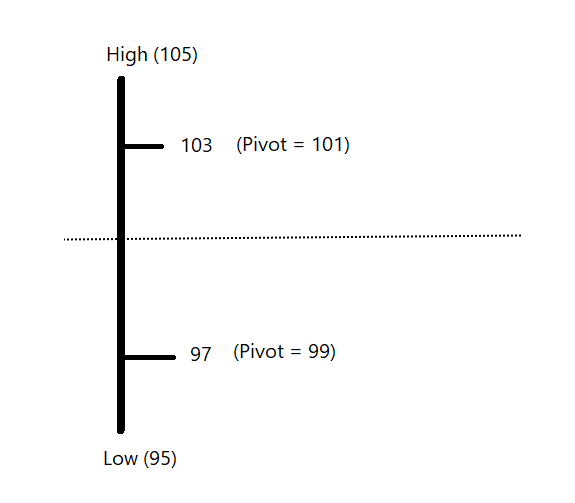
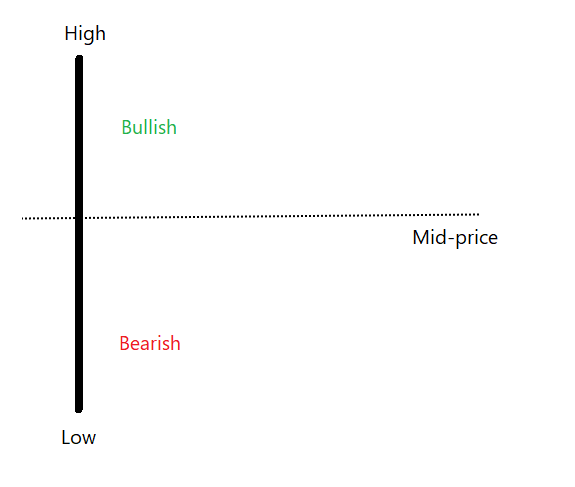
Pivot level captures the relationship of the closing price to the range of the session. It would be above mid-price if close is towards high & below mid-price if the close is more towards low
Let’s say :
Pivot above mid-price = bullish pivot
Pivot below mid-price = bearish pivot
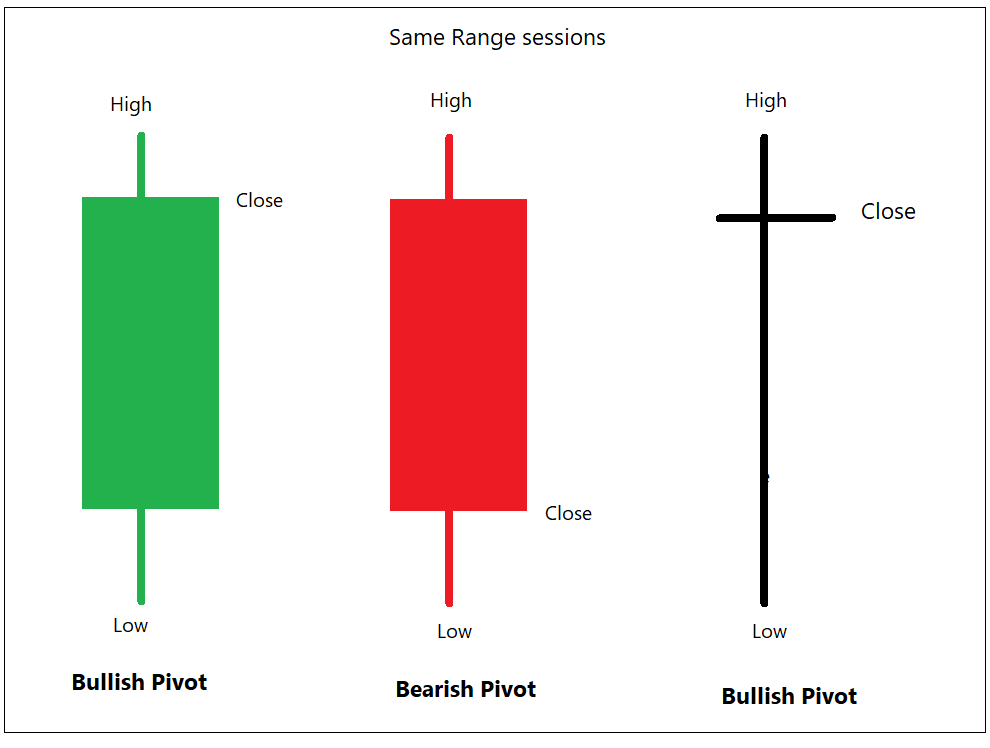
Calculation doesn’t consider whether the candle was bullish or bearish, and whether the closing price was higher or lower than the earlier session. Wide range Doji or bullish Marubozu kind of candle with same length and closing price towards high will have same bullish pivot.
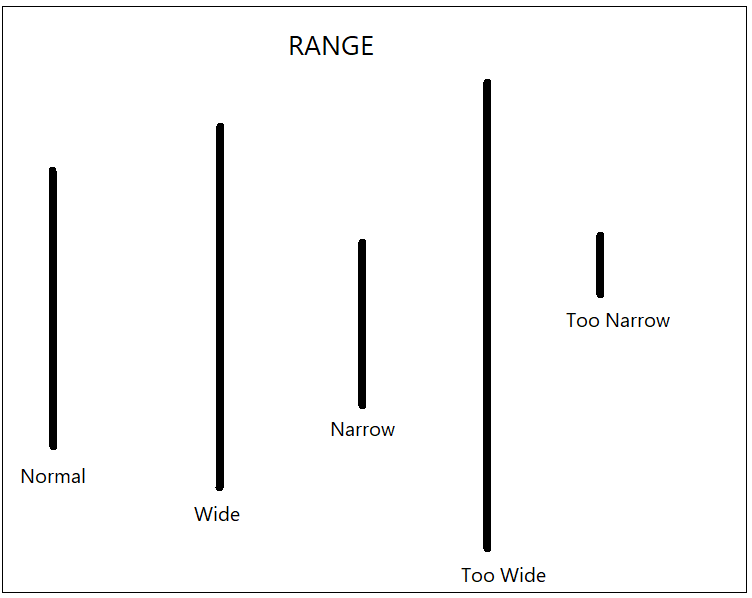
Range of the session is an important ingredient in Pivot calculation. The range of current session would determine the support and resistance level for the next session.
Have a look at the image below and we shall revert to this discussion in a little while.
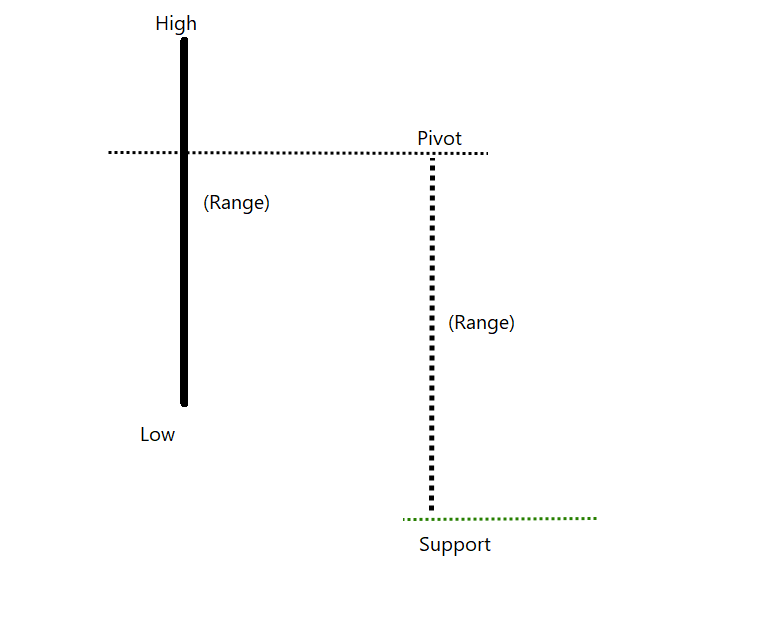
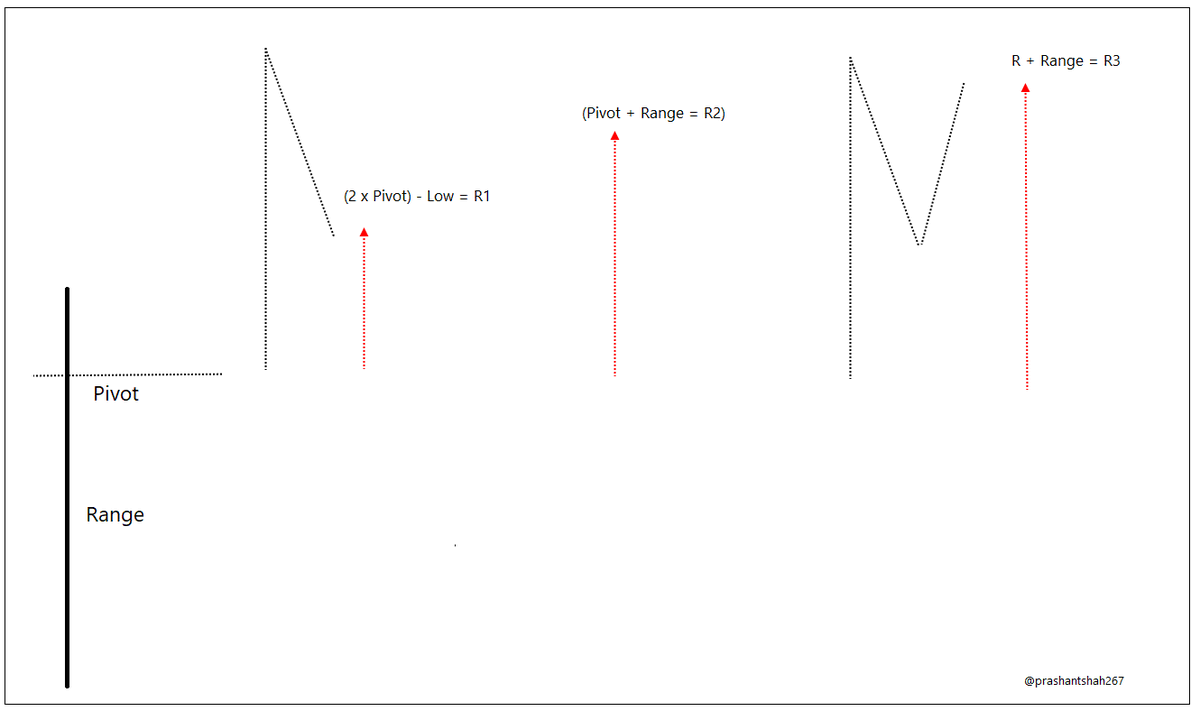
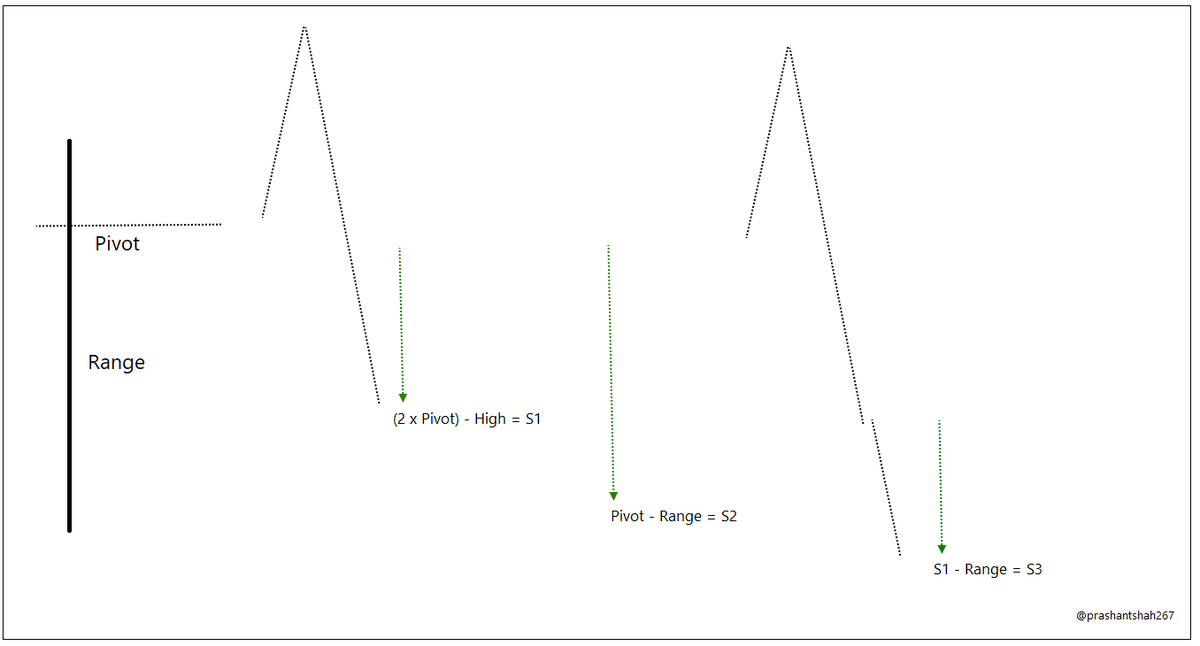
Pivot levels revolved around Pivot price & Range.
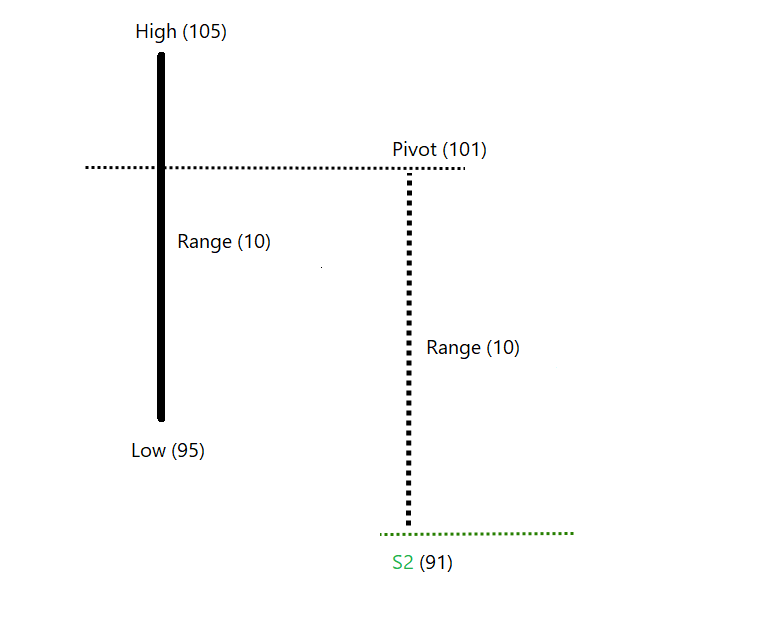
If we deduct the range of the session from the pivot price, we get a support price for the next day.
If the pivot price is bullish, the support level will be nearer. If pivot price is bearish, support level will be deep.
Pivot level in our example is 101.
Support level would be 101 – 10 = 91
This level is known as S2 support level in Pivot calculation.
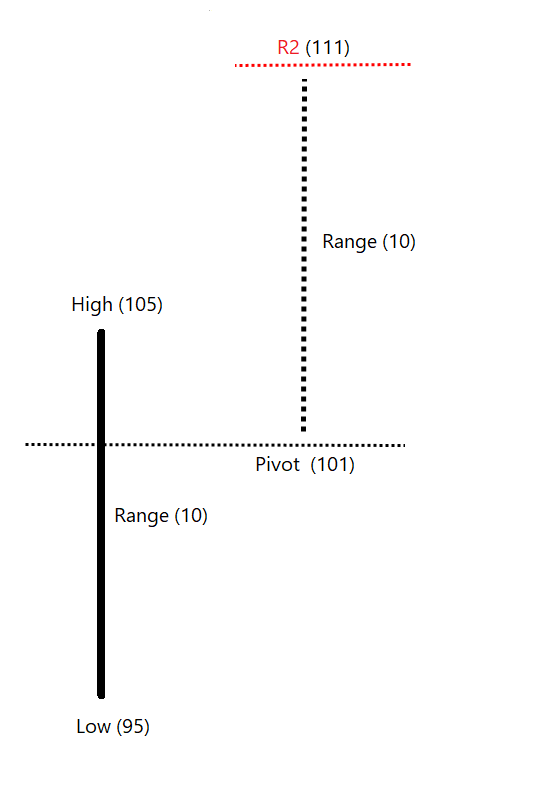
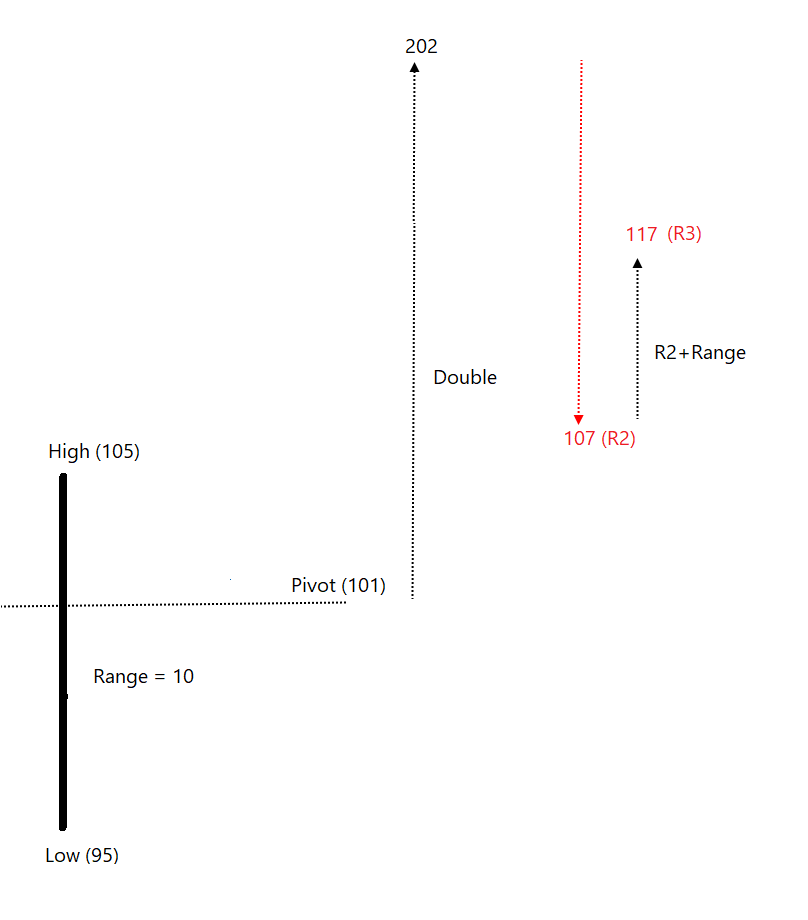
Similarly, we can add range price to pivot price and calculate the resistance level. This is known as R2 level.
The R2 in this example will be 101 + 10 = 111.
We now have the formula to calculate S2 and R2, Let’s discuss S1 and R1.
Difference from high or low price of the day to the pivot point would also be an important clue.
The calculation is a bit tricky. Let’s understand it in two steps.
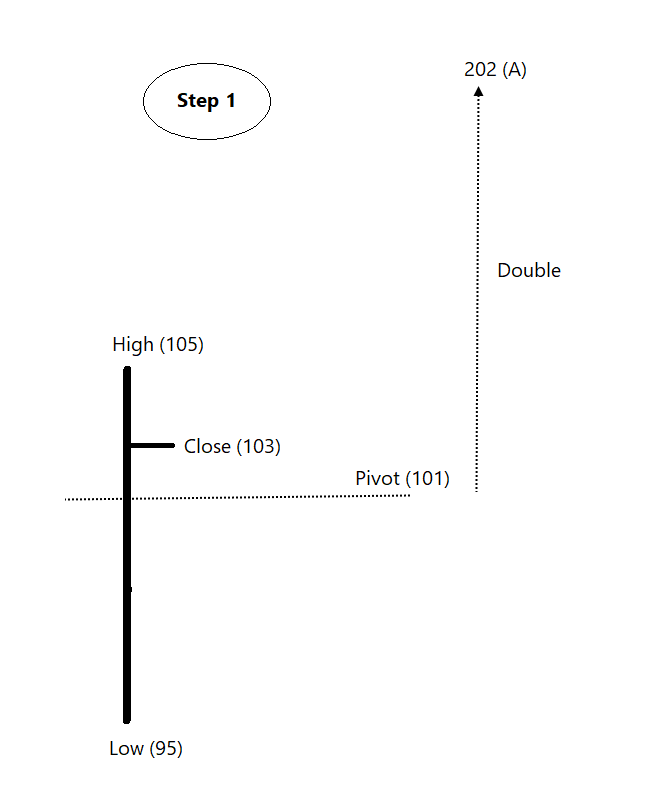
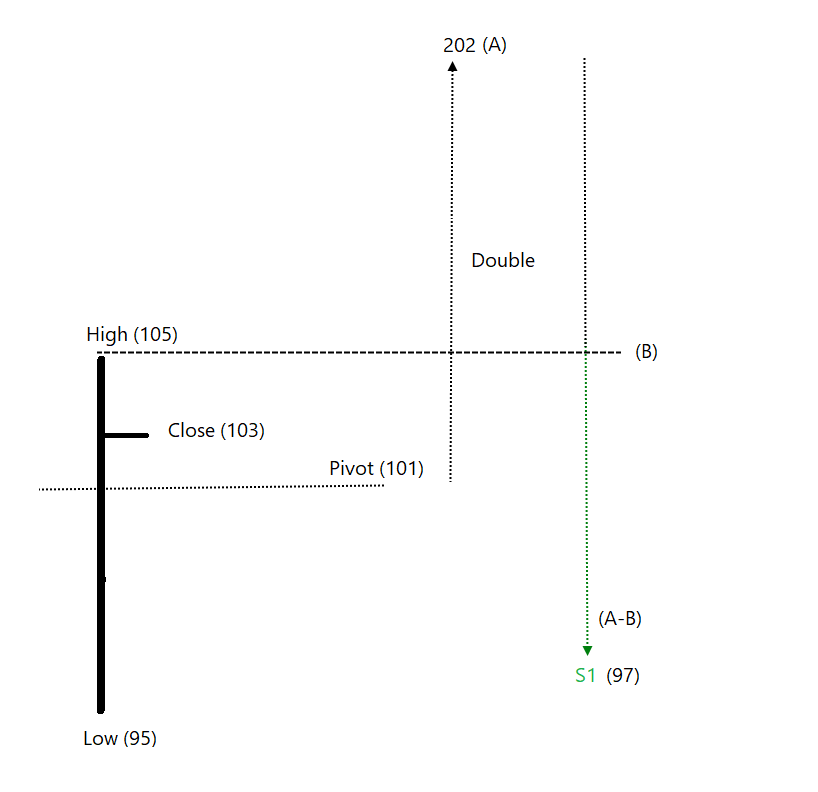
Step 1 is to double the pivot level.
101 x 2 = 202. Let’s call it A.
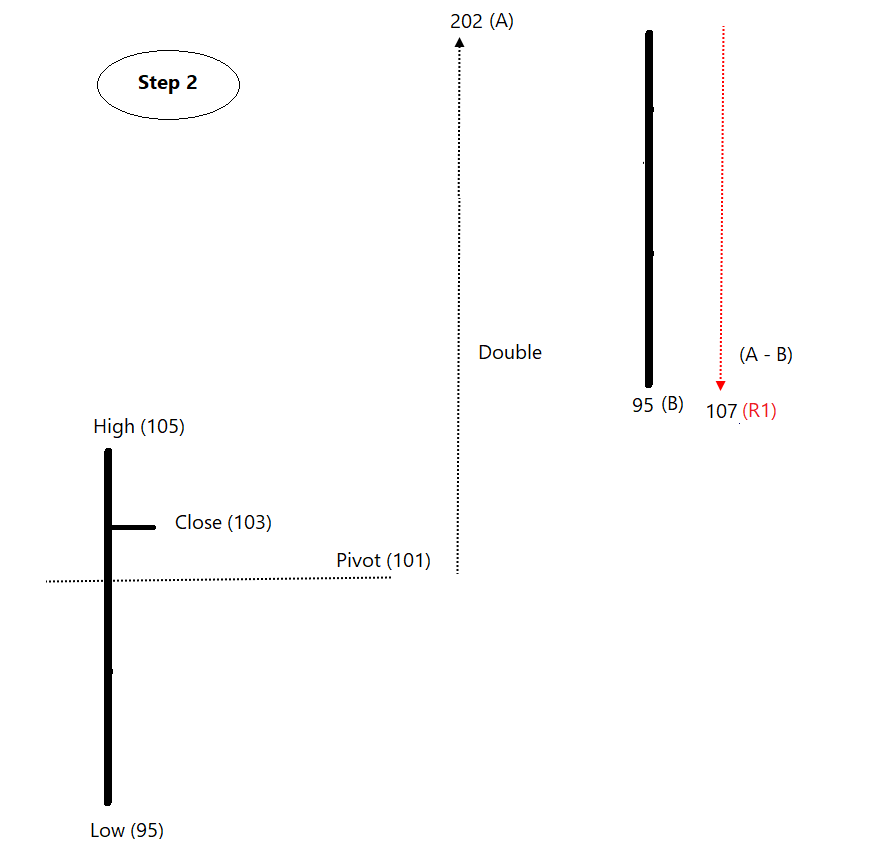
Let’s call low price of the session as B. Second step to get R1 is to deduct the low price from A.
A – B = R1.
202 – 95 = 107.
This is R1 resistance level for the next session. This level will always be below R2.
If previous high is deducted from A, it becomes S1.
202 – 105 = 97.
This level will be always above the S2.
Usually, price is expected to remain between the R2 & S2 levels.
What if price crosses above R2?
It is a sign of a strong trend.
What can be the expected level to refer next?
Previous session range above R1 could be enough for bulls.
So, R2 + Range would be R3. 107 + 10 = 117
Same logic is used for calculating S3. The formula for calculating S3 = S1 – Range.
In this example, S3 = 97- 10 = 87.
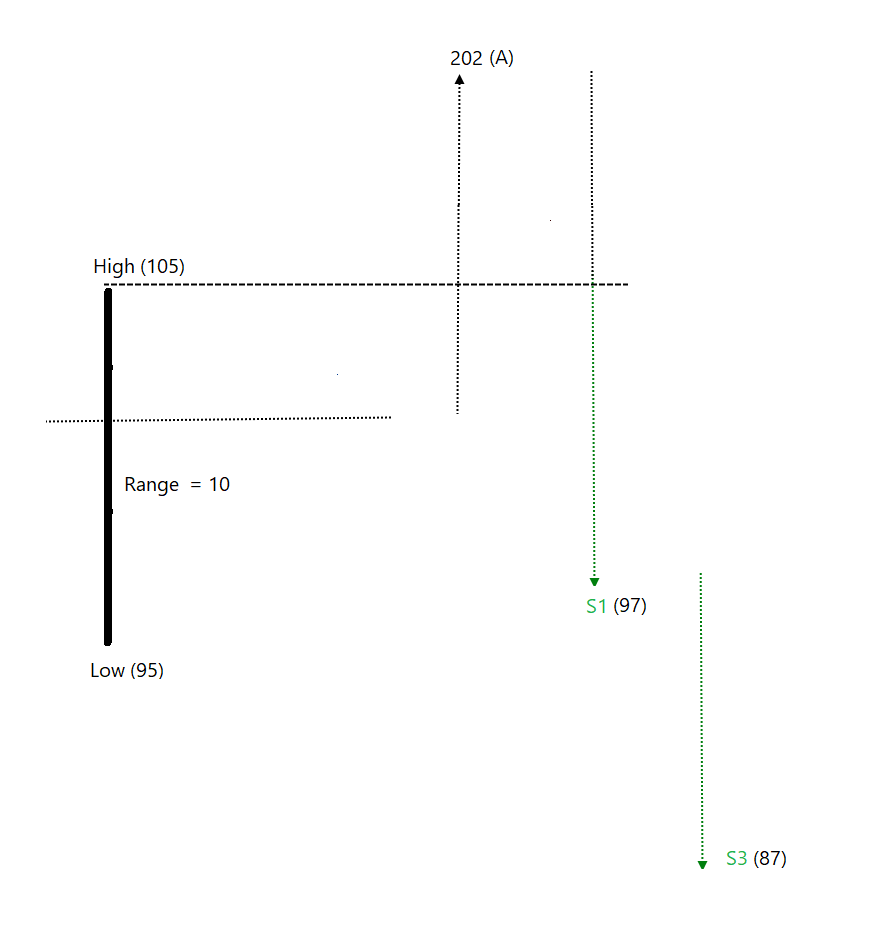
Below are the images capturing the calculation of all three support (S1, S2 and S3) and resistances (R1, R2 and R3) levels that we have discussed.
The calculation method is such that the sequence would always be R1 -> R2-> R3 above pivot level & S1-> S2-> S3 below pivot level.
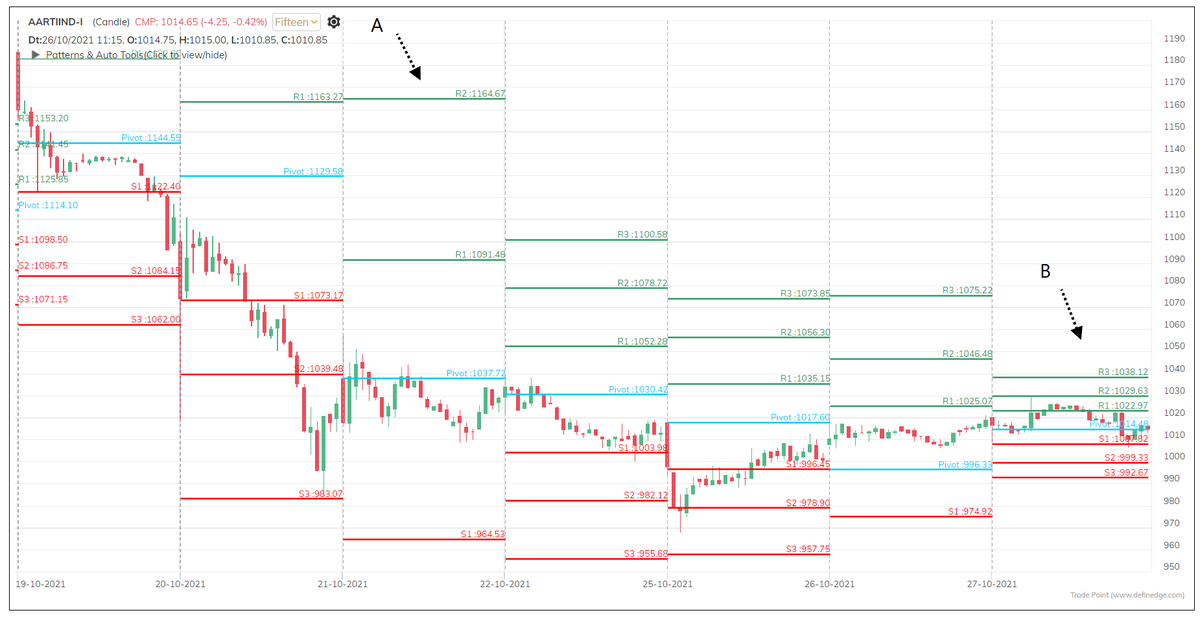
Have a look at below chart showing pivot levels for different sessions on a fifteen-minute candlestick chart.
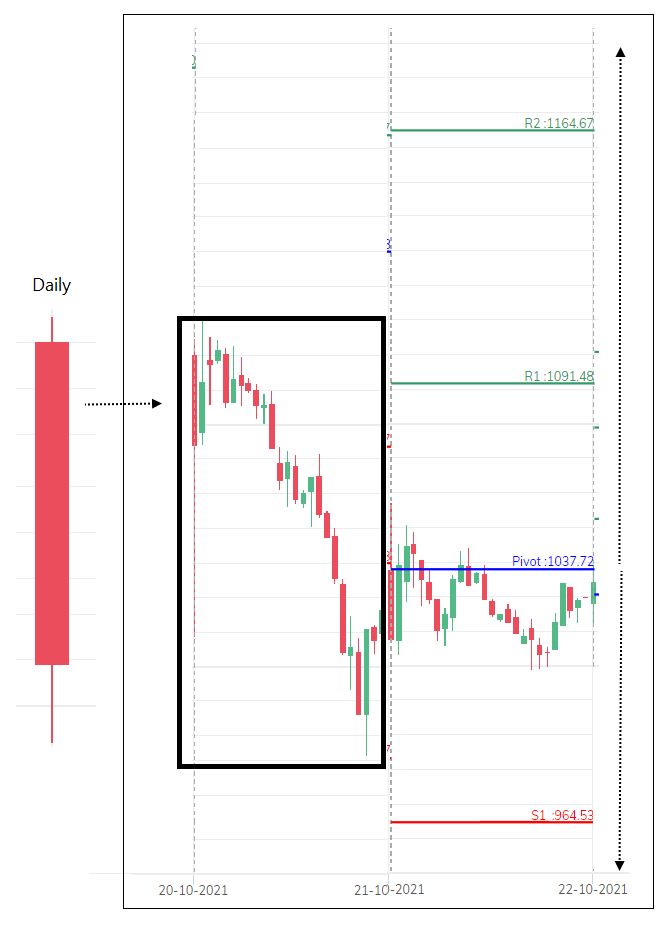
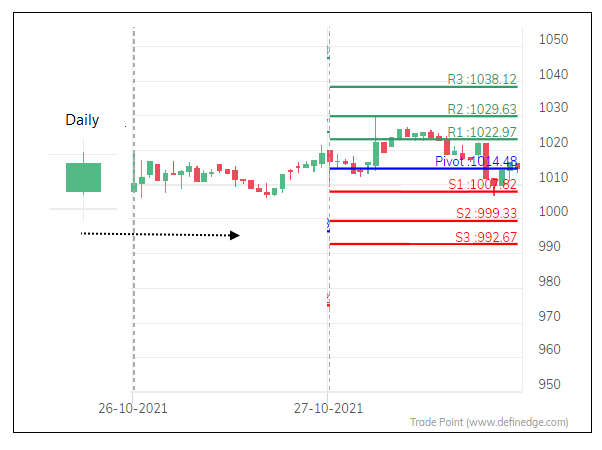
Observe Pivot ranges on day A and B.
Note how the distance between Pivot level depends on the range of the prior day session in the enlarged chart of A and B.
Buying at support & selling at resistance would work well in a range mkt. When the trend is bullish, buying at support & when trend is bearish, selling at resistance strategy would a logical course of action.
Exit at resistance level in uptrend instead of initiating shorts.
Price sustaining above pivot is bullish, sustaining below pivot is bearish.
Simply put,
If price > Pivot and Current session pivot > previous session pivot = bullish trend.
If price < Pivot and current session pivot < previous session pivot = bearish trend
Else, it is range day.
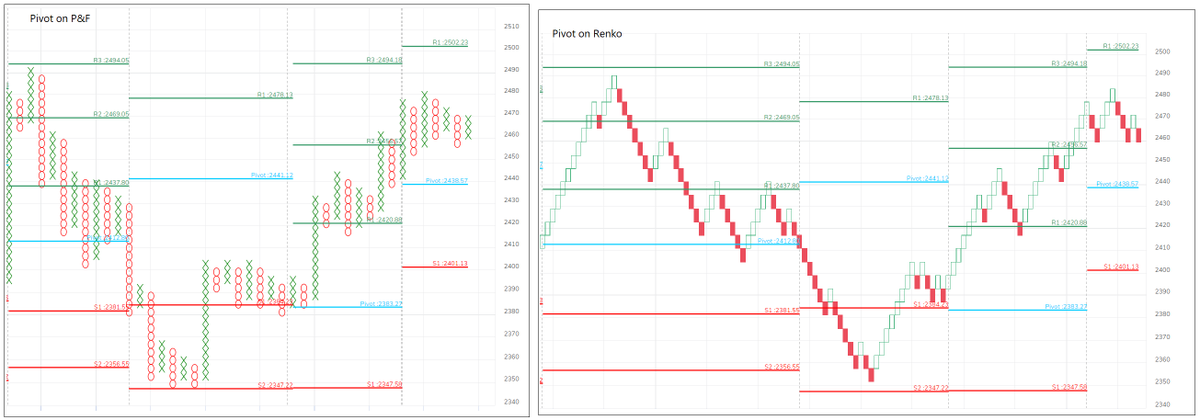
Its a method for confirmation. Trade based on the price pattern. Pivot levels can be beautifully combined with Breadth zone. We can also plot them on Noiseless charts. The calc is performed on prev candle range & levels are plotted on these charts. For me, Is a fascinating idea.

Comments